


Tracking rural markets using satellite imagery offers a new way to monitor economic conditions in remote, data-scarce regions – as demonstrated by a new research paper and online dashboard.
Most development policy has a simple goal: to improve economic conditions, particularly for the poorest. But a central challenge in evaluating and improving policy design is that we currently lack ways to measure short-run changes in local economic conditions in many developing countries. The problem is particularly acute in remote or conflict-affected regions, where poverty is increasingly concentrated (Porciello et al. 2020).
In high-income countries, we can track changes in economic conditions using administrative data, such as employment statistics, sales data, manufacturing production, or tax returns. In many developing countries, however, administrative data collection is slow, incomplete, or inaccurate. In these countries, we often depend on data from representative household surveys: extraordinary logistical operations that dispatch hundreds of field staff to every corner of a country to interview thousands of households. These surveys collect inventories of household assets that can be used as a proxy for wealth, and sometimes data on recent consumption, which can be used as a proxy for income net of savings and transfers. But at best, this data are available every few years, and often with a lag of many months. Conflict or natural disasters can interrupt coverage by preventing surveyors from reaching the field.
To fill in the gaps, researchers have turned to satellite imagery, which is collected regularly independent of what is happening on the ground (Donaldson and Storeygard 2016, Wuepper et al. 2025, Hanney 2025). The earliest applications identified the intensity of light emitted at night as a proxy for wealth (Henderson et al. 2012, Baragwanath et al. 2021). But many poor rural settlements simply do not emit enough light for satellites to pick up a signal, meaning that nightlights are not informative about income levels there (Jean et al. 2016, McCallum et al. 2022). More recently, researchers have used machine learning to predict wealth from high-resolution imagery (Burke et al. 2021). While this technique can be informative about wealth even where nightlights are dark, it implicitly or explicitly depends on the presence of large assets, such as buildings or roads. Since these assets, just like electricity infrastructure, evolve slowly, both approaches are more informative about longer-run changes in economic activity than short-run fluctuations (Asher et al. 2021). Other potential sources of data about economic activity – such as mobile phone data – are not widely available.
To expand the toolkit available to researchers and policymakers, we develop a new method for learning about short-run changes in economic conditions in developing countries, by monitoring rural marketplaces using satellite imagery (von Carnap, Asiyabi, Dingus, and Tompsett 2026). People have gathered at periodic markets since the emergence of trading systems, and weekly markets remain the most tangible manifestation of the market economy in many rural areas of low- and middle-income countries. At these markets, farmers sell their products; consumers buy goods such as clothing, kitchenware, or electronics; and microenterprises do business (Kithuka et al. 2020). Households in East Africa sell most of their crops at such markets (von Carnap 2025).
Mapping rural markets using their distinctive visual signature
Our approach relies on periodic markets looking very different on market days and non-market days. Panels (a) and (b) show a marketplace in rural Mozambique, as seen in very high resolution (30cm resolution) imagery (Figure 1). Panel (a) shows the market on a busy market day, with stalls and even people clearly visible. Panel (b) shows the same marketplace on a non-market day. These periodic appearance changes create a unique temporal signature that allows us to detect the presence of markets even without any other information about their locations. This is a critical first step, because other sources of information about the locations of periodic markets are scarce and not always accurate.
Figure 1: Method intuition and sequence
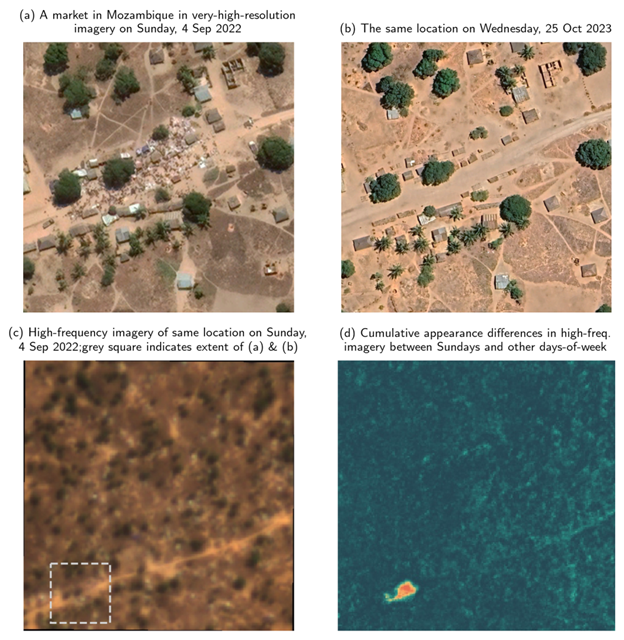
Very high-resolution imagery is expensive and not always available, however. Instead, we turn to lower-resolution PlanetScope imagery (Panel (c); 3m pixels), which is globally available at near-daily frequency, making it potentially much more useful for tracking outcomes over time. But in an individual image at this resolution, the market is barely discernible to the naked eye. The appearance of a place in satellite imagery can also change over time for many other reasons, for example because recent rainfall darkens the soil or through seasonal greening. We detect markets by stacking many images from the same location over time and identifying places where the appearance changes regularly on specific weekdays, as illustrated in Panel (d).
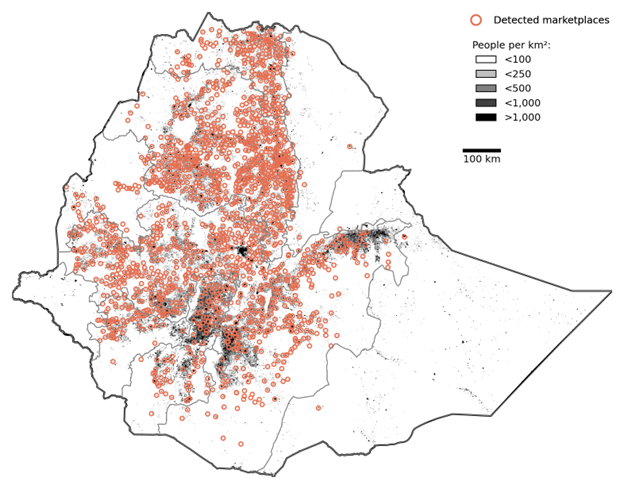
Using validation data from Kenya, Malawi, and Mozambique, we show that we successfully detect markets where they exist and, conversely, that we don’t detect markets where they don’t exist. We then use our approach to generate a map of 1,776 markets in Ethiopia (Figure 2).
Figure 2: Spatial coverage of a novel marketplace map of Ethiopia
Tracking market activity
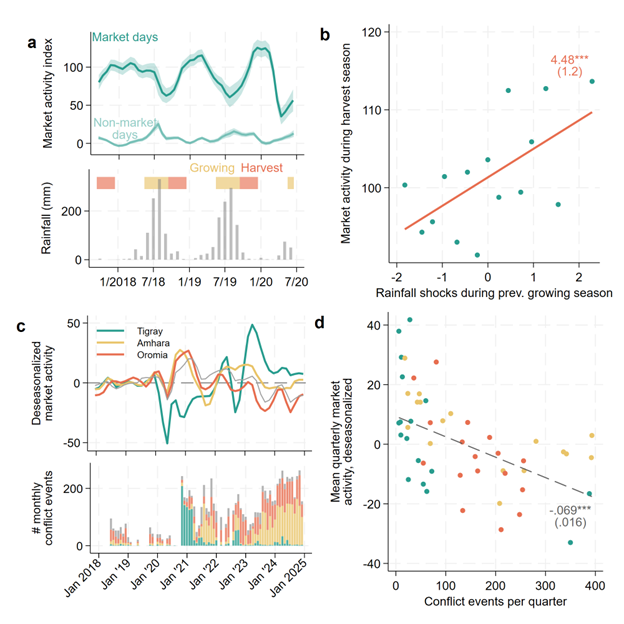
Once we know where markets are, we compare appearance differences on a given market day to other market days at different times to create an index that tracks fluctuations in market activity. All else equal, busier markets reflect more economic activity – attendees either have more income to spend, more goods to sell, or both. More intense market activity over a larger area results in a stronger visual signal. For each market we detect, we create a time series tracking appearance changes over time from 2017 until the present day. We show that market activity is seasonal and follows natural patterns. Activity is lowest early in the growing season – often referred to as the lean season – and rises sharply towards the harvest season, as seen for one administrative zone in Tigray (Figure 3, Panel (a)). Markets are busier after growing seasons with higher rainfall, suggesting that more plentiful harvests and associated higher incomes reflect in higher measured activity (Panel (b)). Market activity declined during the COVID pandemic and recent conflict episodes in Ethiopia (Panels (c) and (d)).
Figure 3: Validation of activity tracking with Ethiopian sample markets
Using the data in research and practice
Our data has many potential applications. Researchers may be able to use it to study the economic impacts of extreme events or policy changes in remote rural areas. The data can also be integrated into early warning systems, like FEWS NET, which aims to provide timely and accurate information about acute food insecurity. Markets are already at the core of the FEWS NET monitoring system, with surveyors tracking prices and goods availability. A satellite-based tool that tracks market activity would complement these existing systems. Given limited budgets, FEWS NET already depends solely on indirect sources of data in some countries, making an additional direct measure of activity potentially particularly useful.
A few limitations are worth keeping in mind. First, our approach means that we detect markets that trade at least partially outside, are active in the late morning when satellites pass overhead, and that operate regularly 1–3 days a week. Fortuitously, these types of market appear widespread in many countries. Second, our approach depends on cloud-free imagery, so it is less useful in places where cloud cover is high through much of the year, such as countries near the equator. Third, our activity measures are not directly comparable across markets, and changes in measured market activity may have different relationships with changes in more general economic activity in different places, depending, for example, on whether markets are a primary source of subsistence goods. Fourth, any individual market’s measured activity is noisy, meaning that it is easier to detect a signal – a trend over time, or a response to a change in conditions – for a group of markets rather than any individual market.
In ongoing work, we are scaling our approach to map markets across the developing world. The dashboard market-activity.net lets you browse where we have detected marketplaces – more than 8,000 across Africa and Asia to date – and explore their activity between 2019 and March 2026.
References
Asher, S, T Lunt, R Matsuura, and P Novosad (2021), “Development Research at High Geographic Resolution: An Analysis of Night-Lights, Firms, and Poverty in India Using the SHRUG Open Data Platform,” World Bank Economic Review, 35: 845–871.
Baragwanath, K, R Goldblatt, G Hanson, and A K Khandelwal (2021), “Detecting urban markets with satellite imagery: An application to India,” Journal of Urban Economics, 125: 103173.
Burke, M, A Driscoll, D B Lobell, and S Ermon (2021), “Using satellite imagery to understand and promote sustainable development,” Science, 371.
Donaldson, D and A Storeygard (2016), “The View from Above: Applications of Satellite Data in Economics,” Journal of Economic Perspectives, 30: 171–198.
Hanney, O (2025), “How economists are using new data sources in development economics,” VoxDev.
Henderson, J V, A Storeygard, and D N Weil (2012), “Measuring Economic Growth from Outer Space,” American Economic Review, 102(2): 994–1028.
Jean, N, M Burke, M Xie, W M A Davis, D B Lobell, and S Ermon (2016), “Combining satellite imagery and machine learning to predict poverty,” Science, 353(6301): 790–794.
Kithuka, D M, E M Irandu, and J M Moronge (2020), “The role of periodic markets in provision of manufactured goods and creation of income in rural areas: a case study of selected markets in Mukaa subcounty, Kenya,” International Journal of Scientific Research and Innovative Technology, 7: 65–79.
McCallum, I, C C M Kyba, J C L Bayas, E Moltchanova, M Cooper, J C Cuaresma, S Pachauri, L See, O Danylo, I Moorthy, M Lesiv, K Baugh, C D Elvidge, M Hofer, and S Fritz (2022), “Estimating global economic well-being with unlit settlements,” Nature Communications, 13(2459).
Porciello, J, H A Tufan, J Njuki, P Winters, E Mabaya, and R Coffman (2020), “Averting hunger in sub-Saharan Africa requires data and synthesis,” Nature.
von Carnap, T (2025), “Rural marketplaces and local economic development,” Unpublished manuscript.
von Carnap, T, R M Asiyabi, P Dingus, and A Tompsett (2026), “Using satellite imagery to map rural marketplaces and monitor their activity at high frequency,” Nature Communications.
Wuepper, D, W A Oluoch, and H Hadi (2025), “Satellite Data in Agricultural and Environmental Economics: Theory and Practice,” Agricultural Economics, 56(3): 493–51.