




Evidence from 100 Social Science Prediction Platform projects shows that research forecasts are too optimistic on average, but still predictive enough to improve study design when they are combined, shrunk, and weighted carefully.
Many social science results feel obvious after the fact. Once a study is presented, audiences can easily conclude that the result was predictable all along. Yet knowing whether a result was truly predictable is important for doing better science: it tells us how much we learned from a paper and helps us better design future experiments.
Ex ante forecasts of research findings offer a simple remedy to hindsight bias (DellaVigna et al. 2019). Before results are known or widely presented, researchers can ask others to predict the key treatment effects, summary statistics, or empirical relationships. Comparing forecasts and results then makes it clear what the informational value of a study is. Forecasts can also help with a more practical task: deciding which experiments to run and how large they should be.
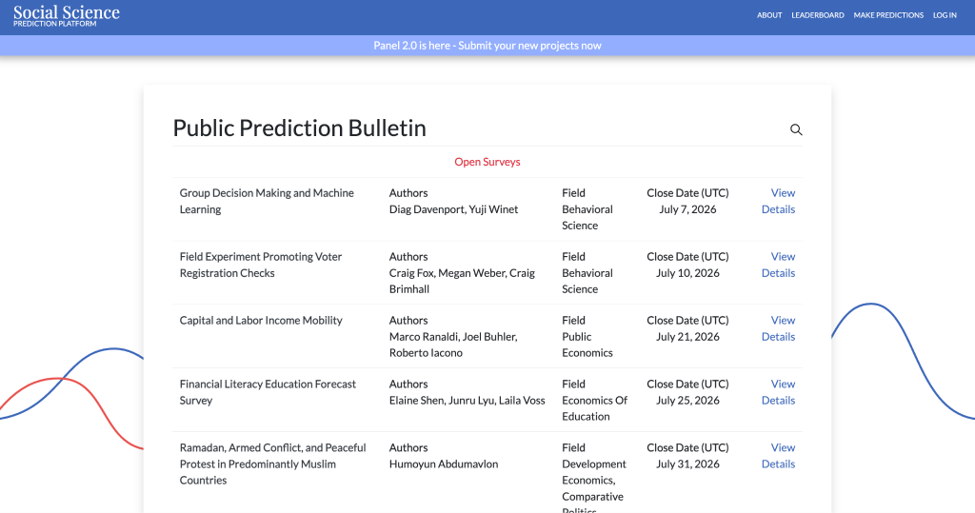
In recent research, we use the Social Science Prediction Platform (SSPP) to study how well people forecast social science findings at scale (DellaVigna and Vivalt 2026). The SSPP, launched in 2020 by Stefano DellaVigna and Eva Vivalt, allows authors to collect predictions about the main findings of ongoing or not-yet-public research projects. Between July 2020 and December 2024, 100 projects were posted on the platform, generating 53,298 forecasts from 4,721 unique forecasters across 1,482 key questions.
A large dataset on research forecasts
The first 100 SSPP projects span economics, psychology, and political science, with particularly large representation from development economics and behavioural and experimental economics. For 66 projects, we can match at least some forecasts to realised results, making it possible to measure forecast accuracy. For 43 projects, the forecasts are of treatment effects that can be normalised into standard deviation units, yielding 15,981 forecasts on 436 treatment-effect questions.
Previous studies have shown that forecasts can be informative in specific experiments, replication exercises, or small collections of studies. The SSPP data allows us to ask broader questions: Are forecasts systematically biased? Are average forecasts predictive of actual results? Which forecasters are more accurate? And can those answers be used to design better experiments?
An important caveat is that the sample is not a random draw from all social science. Projects that are posted on the platform for forecasting may differ from other projects, and some projects on the platform do not yet have results. But the average treatment effect in the SSPP sample, 0.10 standard deviations, is close to benchmarks from large collections of impact evaluations (Vivalt 2020) and nudge-unit RCTs (DellaVigna and Linos 2022). The projects do not appear, on this dimension, to have unusually low or high treatment effects.
Figure 1: SSPP public prediction bulletin
Forecasters are optimistic, but not guessing
On average, forecasters overestimate treatment effects. Across the normalised treatment-effect questions, the average realised effect is 0.10 standard deviations, while the average forecast is 0.18 standard deviations. Comparing each forecast to the corresponding result gives an average overestimate of 0.09 standard deviations. This pattern is not driven by outliers, as the median forecast also exceeds the median result.
This optimism can affect research design. If researchers expect effects to be larger than they are, they may choose samples that are too small, compare too many treatment arms with too little power, or over-invest in interventions that are less promising than they appear ex ante (Ioannidis et al. 2017).
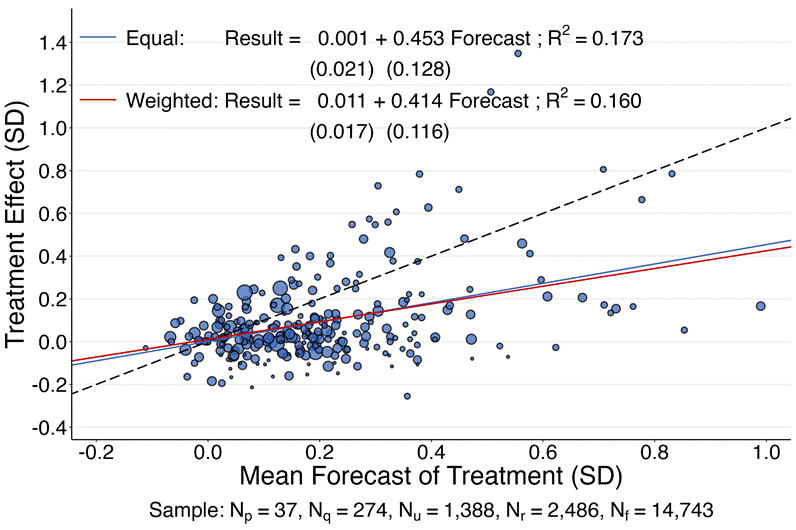
At the same time, forecasts still add value. When the average forecast for a key question is higher, the eventual treatment effect tends to be higher as well. Among questions with at least 20 forecasts, a 0.1 standard deviation increase in the average forecast predicts a 0.045 standard deviation increase in the realised effect. The relationship is not one-to-one, but forecasts contain useful information.
Figure 2: Predictability of results from average forecasts
Small crowds help a lot
Researchers do not need to collect forecasts from large samples to obtain useful information. Even averaging five randomly selected forecasts raises accuracy by 23% relative to an individual forecast. Averaging 10 forecasts raises accuracy by 27%, and averaging 20 raises it by 29%. The returns to aggregating multiple forecasts are therefore steep at first and then flatten.
This is good news for authors. A short, focused forecast survey that collects even a modest number of responses can provide a meaningfully better signal than an individual forecast. The survey does not need to replicate a large expert panel to be useful, especially if the goal is to choose treatment arms or inform power calculations.
Who forecasts well?
Some kinds of expertise matter, but not always the types of expertise one might expect. Academics are more accurate than non-academics on the same questions. Faculty forecasts are 17% more accurate than non-academic forecasts, and forecasts by PhD students from top-10 US economics departments are 19% more accurate. Academics also tend to predict smaller treatment effects, which helps because the average forecast is too optimistic.
Field expertise, however, does not add predictive power once academic status is accounted for. Forecasters are not significantly more accurate when predicting projects in their own field or subfield. A development economist, for example, is not systematically more accurate on development projects than on other projects in the SSPP data. We do not rule out the possibility that an expert in a particular topic area could make better forecasts on that narrow topic, but we do not observe any evidence of domain expertise mattering more broadly within a subfield.
Experience is also not the only attribute of forecasters that matters. A panel of motivated repeat forecasters is 12% more accurate than other forecasters, but frequent forecasters outside that panel do not show the same advantage. The evidence points more towards selection of careful forecasters than simple learning from repeated participation.
Confidence is a warning sign
The most striking individual-level result concerns confidence. One might expect forecasters who say they are more confident to be more accurate – perhaps there is some signal in their confidence. In the SSPP data, the opposite occurs. Forecasters with above-median confidence are 16% less accurate than those with below-median confidence.
The reason is that high-confidence forecasters predict substantially larger treatment effects. Their forecasts are 54% higher, on average, for questions about treatment effects. Because the average forecast already overestimates effects, this additional optimism reduces accuracy. For researchers collecting forecasts, stated confidence should therefore be treated cautiously. It does not necessarily reflect better calibration.
Interestingly, once we control for individual forecaster fixed effects, this result goes away, suggesting it was driven by those who are overconfident in general, rather than confident with respect to a particular study.
Superforecasters of scientific results exist
The SSPP makes it possible to link the same forecasters across projects, which allows us to ask whether some people are persistently more accurate. Among forecasters with predictions on at least five projects, relative accuracy in four projects strongly predicts relative accuracy in a held-out project. The cross-project slope is 0.47, while a placebo comparison is flat.
In other words, the top third of forecasters based on prior in-sample accuracy are 33% more accurate out of sample than the bottom third. When forecasting research results, as in other forecasting domains (Tetlock and Gardner 2016), there are superforecasters. These individuals are less prone to extreme forecasts and less likely to display the high confidence that is associated with poor accuracy.
Use forecasts, but shrink them
Relative to a single individual forecast, a wisdom-of-the-crowd forecast greatly reduces mean squared error. Yet because average forecasts are too optimistic, even a well-calibrated constant forecast can outperform an unadjusted crowd forecast.
The solution is to shrink forecasts before use. In the SSPP data, the optimal prediction gives only about 0.4 weight to the average crowd forecast and combines it with an intercept based on out-of-sample studies. This shrunk forecast lowers mean squared error by 10% relative to a constant-forecast benchmark.
Accuracy improves further when forecasts from ex ante more accurate forecasters receive more weight. A model that shrinks the average forecast and overweights the predicted top forecasters lowers mean squared error by an additional 4.7% relative to shrinkage alone. But, due to the wisdom-of-the-crowd effect, it is still useful to put non-zero weights on forecasts from less accurate forecasters. To obtain better forecasts of treatment effects, researchers should aggregate forecasts, adjust for optimism, and use past accuracy and observable predictors of accuracy when available.
Implications for experimental design
One of the most impactful use cases for forecasts is to use them to improve design before the study is run. In the SSPP sample, the average sample size for an experimental treatment arm is 2,330 subjects. If those choices reflected conventional 80% power calculations, they would imply an expected effect size of 0.19 standard deviations. However, the realised average treatment effect is only 0.095 standard deviations in the group for which this can be calculated, and the actual average power is 0.44 rather than 0.80.
If researchers instead used the optimally shrunk and weighted forecast to power studies, using the larger of the optimal forecast and 0.05 standard deviations, average power would rise to 0.65, though it would require sizeably larger samples.
A more selective rule may be more realistic. If researchers only ran treatment-outcome combinations whose optimal forecast exceeded 0.05 standard deviations, the implied sample size would be 3,667, only 55% larger than the actual sample size in those same treatment-outcome combinations, and power would rise to 0.63. The treatment-outcome combinations that would be dropped have much lower realised effects, averaging 0.04 standard deviations, and would be badly underpowered if run.
What should researchers do?
Our research suggests a few practical steps researchers can take to obtain accurate forecasts for use in their studies. Before results are public, authors should collect a short set of forecasts on the study's key questions. A small crowd is often enough to improve on individual judgement. The forecasts should then be averaged, adjusted downward to account for systematic optimism, and weighted when there is credible information about forecaster accuracy. Forecasts can be used as an alternative null hypothesis, demonstrating how much we learn from the study compared to received wisdom. Gathered early, they can also improve experimental design by improving power calculations or changing which treatment arms are run.
There are caveats. The SSPP projects are selected, and results may change as forecasting spreads to a wider set of researchers and topics. We also still have much to learn about how artificial intelligence tools could best be used to improve forecast accuracy, a topic we have begun to explore with the SSPP. But the central message is already clear: forecasts contain useful information and social scientists can use that information to design more informative studies.
References
DellaVigna, S, and E Vivalt (2026), "Forecasting social science: Evidence from 100 projects," Unpublished manuscript.
DellaVigna, S, D Pope, and E Vivalt (2019), "Predict science to improve science," Science, 366(6464): 428–429.
DellaVigna, S, and E Linos (2022), "RCTs to scale: Comprehensive evidence from two nudge units," Econometrica, 90(1): 81–116.
Ioannidis, J P, T D Stanley, and H Doucouliagos (2017), "The power of bias in economics research," Economic Journal, 127(605): F236–F265.
Tetlock, P E, and D Gardner (2016), Superforecasting: The Art and Science of Prediction, Random House.
Vivalt, E (2020), "How much can we generalize from impact evaluations?" Journal of the European Economic Association, 18(6): 3045–3089.