


A model of trade and agriculture applied to Sri Lanka’s 2021 chemical fertiliser import ban shows how costly fertiliser shortages can be. However, the model also shows why local field-experiment estimates of fertiliser’s effect on crop yield can exaggerate the economy-wide impact of a nationwide shortage: when fertiliser becomes scarce, wages, crop prices, and production choices adjust, partly cushioning the yield losses. Applying the same framework to a severe fertiliser disruption through the Strait of Hormuz suggests smaller, but still meaningful, effects.
Editor’s note: For a broader synthesis of themes covered in this article, check out Issue 2 of our VoxDevLit on International Trade. The authors have made slides available here.
Chemical fertilisers are among the most important intermediate inputs in the global economy. They increase productivity in agriculture, which accounts for roughly a quarter of employment worldwide, fostering growth and reducing poverty (Gollin et al. 2021, Adamopoulos and Restuccia 2022). Yet production is highly concentrated: just five countries supply more than 60% of global fertiliser nutrients, and over 80% of countries import at least three-quarters of the fertiliser they use.
This concentration leaves global fertiliser supply highly exposed to geopolitical shocks (Farrokhi and Pellegrina 2025). The 2022 Russian invasion of Ukraine triggered the largest surge in global fertiliser prices in decades, and the ongoing 2026 US–Iran war has effectively shut down the Strait of Hormuz, through which roughly a third of global seaborne fertiliser trade passes.
What happens when an entire country loses access to fertiliser? Can one intermediate input reshape an entire economy? In recent work (Ghose, Fraga, and Fernandes 2026), we answer these questions by exploiting a rare natural experiment: an abrupt ban on chemical fertiliser imports in Sri Lanka, where more than 95% of fertiliser was imported and organic substitutes were limited.
What happened: Three stylised facts
Sri Lanka banned chemical fertiliser imports in May 2021, reversing course in November amid widespread social unrest, yet the effects rippled through the economy for much longer. Using customs microdata, agricultural production statistics, satellite-based yield estimates, and firm-level export records, we document three stylised facts.
- Fertiliser imports collapsed. Import volumes fell by more than 99% within four months of the ban and stayed depressed thereafter. There was no substitution towards organic fertiliser: the organic share never exceeded 4%.
- Agricultural yields fell sharply. Rice yields declined in Sri Lanka by about 25%, after accounting for weather, during the main growing season. Figure 1 shows the decline of three staple crops.
Figure 1: Crop yields in Sri Lanka before and after the 2021 fertiliser import ban (2013 = 100)
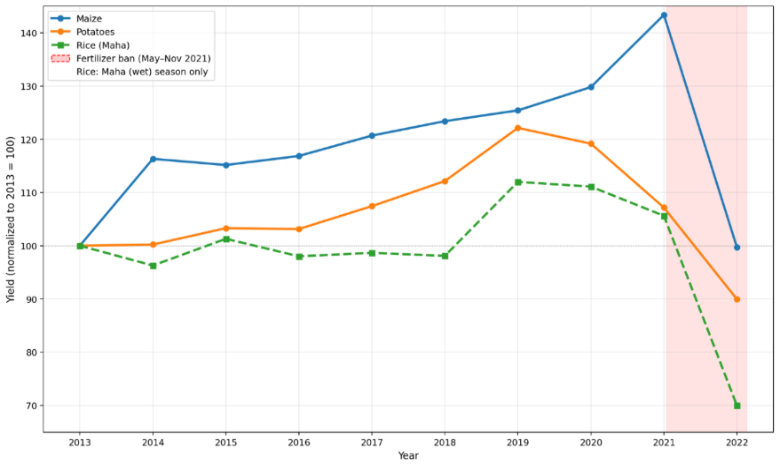
Note: Shaded band marks the ban period (May–November 2021). Source: Authors’ calculations based on Ghose et al. (2026).
- Exports of fertiliser-intensive agricultural products collapsed. Using a firm-level exposure measure based on firms’ pre-ban crop export mix and agronomic fertiliser requirements, highly exposed firms saw exports fall by 35% relative to less-exposed firms in the four quarters after the ban, controlling for seasonality and the broader 2022 macroeconomic crisis.
Quantifying the damage: A spatial general equilibrium model
Our reduced-form facts are silent on welfare, distributional effects, and spillovers to the rest of the economy. We build a quantitative spatial model, related to trade and agriculture frameworks such as Sotelo (2020) and Nath (2025). The model has three types of agents (landowning farmers, mobile workers, and immobile tea estate workers) and includes 25 Sri Lankan districts. The model incorporates key features of developing economies: land inequality, fertiliser subsidies, import quotas, and non-homothetic preferences capturing how food expenditures decline with income.
The estimated model gives the headline result that the ban reduces average welfare by the equivalent of a 7.3% drop in income. But this average masks important variation. Mobile workers – who can reallocate across sectors – lose only 0.7% of their income, as manufacturing acts as a buffer. Farmers, whose income is tied to land, lose around 19.5%, and up to 23% in the most fertiliser-intensive districts (Figure 2).
Figure 2: Spatial heterogeneity in welfare effects, by district, for the representative farmer (left) and mobile worker (right)
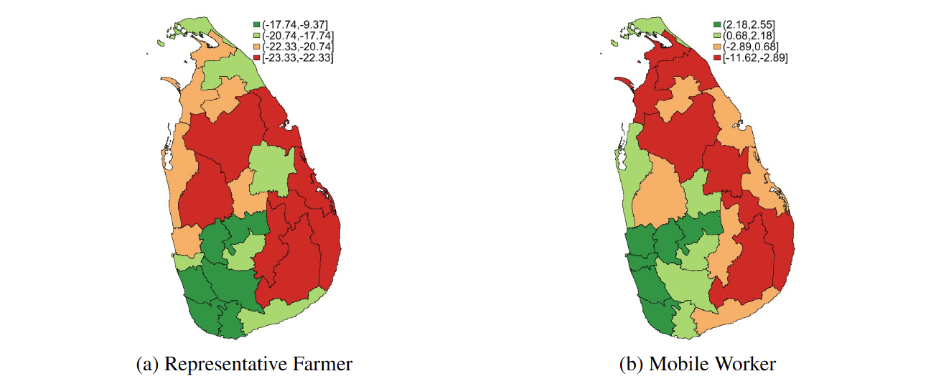
Notes: Darker red = larger losses. The figures show the % change in the welfare of each district’s representative farmer (panel a) and mobile worker (panel b) between the baseline equilibrium with no quantitative restrictions and the counterfactual equilibrium with quantitative restrictions. Welfare % change is defined as an equivalent variation (EV): starting from an agent’s baseline (net-of-tax) income, the EV is the % change in (net-of-tax) income that would leave her with the same utility level as she has in the counterfactual equilibrium, keeping prices fixed at baseline levels. Source: Ghose et al. (2026).
Counter to its aim of saving foreign exchange, the ban reduced agricultural exports by US$596 million, with the decline concentrated in fertiliser-intensive crops such as tea, rice, and maize (Figure 3).
Why this matters beyond Sri Lanka: General Equilibrium vs. Partial Equilibrium effects
Most evidence on fertiliser returns comes from randomised controlled trials on small groups of farmers (Beaman et al. 2013, Duflo et al. 2011, Carter et al. 2021). These are invaluable for measuring localised effects but miss general-equilibrium adjustments. Providing fertiliser to a few hundred farmers does not change rural wages or crop prices, but a nationwide shock does.
We contrast crop-yield elasticities under a partial-equilibrium (PE) scenario, where only the fertiliser price changes, and a general-equilibrium (GE) scenario, where wages and crop prices also adjust. Crop-yield elasticities with respect to fertiliser are 20–50% lower in GE than in PE. For rice and maize – Sri Lanka’s major food crops – the production decline is attenuated by 39% and 35%, respectively, once GE adjustments take hold. Intuitively, the ban pushes down agricultural wages (as labour demand in agriculture falls) and pushes up crop prices (as supply falls). Both effects partially offset the initial yield losses.
Figure 3: Ban effects on exports, by crop, plotted against each crop’s fertiliser intensity
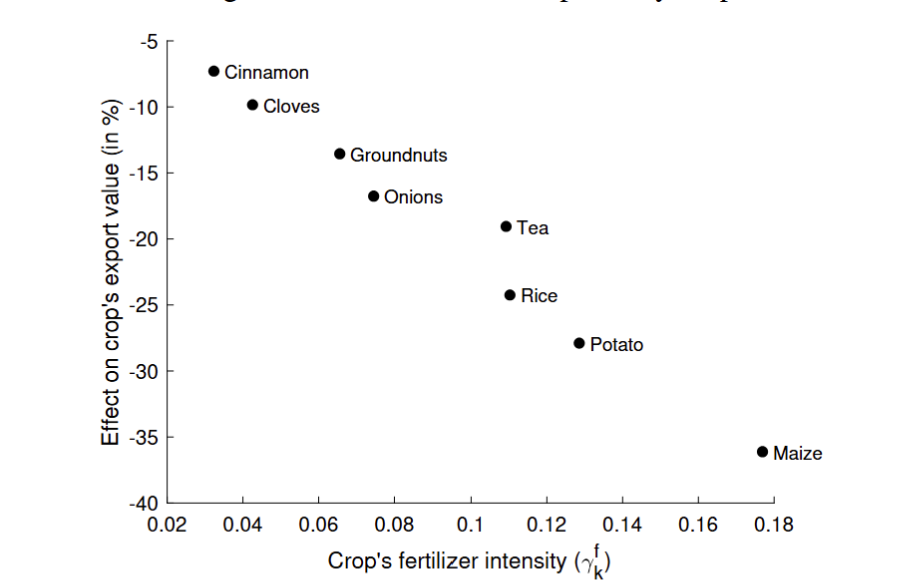
Notes: The figure plots the fertiliser intensity of each crop against the % change in the value of the crop’s exports from Sri Lanka to the rest of the world between the baseline equilibrium with no quantitative restrictions and the counterfactual equilibrium with quantitative restrictions. The fertiliser intensity of crop k is defined as the fertiliser coefficient in its Cobb-Douglas production function. The export value of crop k is the total crop-k sales of Sri Lanka to the rest of the world. The correlation coefficient between fertiliser intensity and % change in export value is -0.986. Source: Ghose et al. (2026).
Our model-implied PE elasticities closely match those in the experimental evidence base. But those estimates apply to a different object: the effect of a local intervention, not a national supply shock. Policymakers who extrapolate from experimental evidence to design nationwide interventions will – as our findings suggest – systematically overstate the damage from large fertiliser shocks.
Recent work shows that fertiliser shocks, input subsidies, and food-trade restrictions can look very different once economy-wide price, production, and household responses are taken into account (Artuc et al. 2023, Bergquist et al. 2026, Brooks and Donovan 2026).
What does this say about the Iran war?
Our framework is well-suited to an urgent policy question: what are the likely consequences of the current Strait of Hormuz disruption for fertiliser-dependent importers? The Strait carries roughly 30–35% of global seaborne fertiliser trade, and analysts estimate the disruption has removed around 30–36% of global supply. Sri Lanka – which imports more than 95% of its fertiliser – is both a prime example of a vulnerable country and the one for which our model is calibrated.
Feeding a 36% fertiliser-supply disruption into our model produces a 55% rise in the domestic fertiliser price, with yield declines of roughly 4.7% for rice, 5.7% for potato, and 8.5% for maize, and a ∼6% rise in the agricultural price index. The implied food-price elasticity to fertiliser prices of around 0.09–0.13 is somewhat below the 0.2 elasticity used in OECD-FAO outlooks for nitrogen-intensive crops, reflecting the GE attenuation built into our model.
Aggregate welfare falls by about 0.2% of income under this scenario, driven by higher food prices and falling income. The full 7% welfare loss we estimated for the 2021 ban is best thought of as an upper bound: what a country with Sri Lanka’s structure would face if imports were cut off entirely via self-imposed policies, rather than reduced by a third via external disruptions.
Policy implications: Trade and agriculture
Trade restrictions on essential imported inputs – whether self-inflicted, as in Sri Lanka, or externally imposed, as through the Strait of Hormuz – are costly, especially for small countries lacking domestic production capacity. Three broader lessons stand out:
- Import bans can backfire: In Sri Lanka, the attempt to save foreign exchange was undermined by an estimated $596 million decline in agricultural exports.
- Small experiments can mislead at scale: applying partial-equilibrium elasticities from RCTs to nationwide shocks overstates damage to crop yields by 20–50%.
- The burden falls unevenly: farmers in fertiliser-intensive districts lose nearly a quarter of their income while mobile workers who can change occupations lose much less. Any policy response to the Hormuz disruption – subsidies, cash transfers, or safety nets – must reflect this distributional reality.
References
Adamopoulos, T and D Restuccia (2022), “Geography and agricultural productivity: Cross-country evidence from micro plot-level data”, The Review of Economic Studies 89(4): 1629-1653.
Artuc, E, G Falcone, G Porto, and B Rijkers (2023), “War-induced food price inflation imperils the poor,” World Bank Policy Research Working Paper 10568.
Beaman, L, D Karlan, B Thuysbaert, and C Udry (2013), “Profitability of fertilizer: experimental evidence from female rice farmers in Mali,” American Economic Review 103(3): 381–386.
Bergquist, L F, B Faber, T Fally, M Hoelzlein, E Miguel, and A Rodríguez-Clare (2026), “Scaling Agricultural Policy Interventions,” Unpublished manuscript.
Brooks, W, and K Donovan (2026), "Industrial policy with development characteristics: Fertilizer subsidies in a time of crisis," Unpublished manuscript.
Carter, M R, R Laajaj, and D Yang (2021), “Subsidies and the African Green Revolution: direct effects and social network spillovers of randomized input subsidies in Mozambique,” Quarterly Journal of Economics 136(4): 1965–2007.
Duflo, E, M Kremer, and J Robinson (2011), “Nudging farmers to use fertilizer: theory and experimental evidence from Kenya,” American Economic Review 101(6): 2350–2390.
Farrokhi, F and H Pellegrina (2023), “Trade, technology, and agricultural productivity,” Journal of Political Economy 131(9): 2509–2555.
Gollin, D, C Hansen and A Wingender (2021), Two Blades of Grass: The Impact of the Green Revolution, Journal of Political Economy 129(8): 2344–2384.
Ghose, D, E Fraga, and A Fernandes (2026), “Trade Policy and Access to Intermediate Inputs: Quantifying the Welfare Costs of a Fertilizer Shortage,” World Bank Policy Research Working Paper.
Muralidharan, K and P Niehaus (2017), “Experimentation at scale,” Journal of Economic Perspectives 31(4): 103–124.
Nath, I (2025), “Climate Change, the Food Problem, and the Challenge of Adaptation through Sectoral Reallocation,” Journal of Political Economy, 133: 1785–1843.
OECD-FAO (2023), Agricultural Outlook 2023–2032, OECD Publishing, Paris.
Sotelo, S (2020), “Domestic Trade Frictions and Agriculture”, Journal of Political Economy 128(7): 2690–2738.